Low-order Structural Aerodynamics
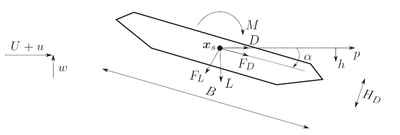
Fluid-structure interaction is a complex phenomenon that involves two distinct mediums: a fluid and a solid. Simulating fluid-structure interaction can be accomplished through solving the coupled partial differential equations of the fluid and solid by means of numerical methods. These techniques require discretizing the fluid equations on many degrees of freedom, be that vortex particles, volume cells, or finite elements, and usually require long computational times. When we are interested in the effect of the fluid on the structure, low-order aerodynamic models are like a secret weapon since they model the forces as a function of the motion of a 2D rigid deck (3 degrees of freedom) and free-stream turbulent fluctuations, thereby reducing the degrees of freedom of the fluid and increasing computational efficiency. This provides deeper insight into the underlying physics, helping us understand the factors contributing to the modeled phenomena. Aerodynamic forces are also one of the most important aspects when designing slender civil structures, such as bridges, towers and masts.
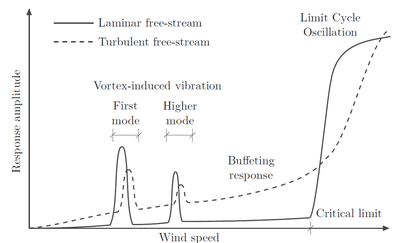
Aerodynamic force models can be broadly classified into two categories: semi-analytical and data-driven. Semi-analytical models are white-box models based on physics and use aerodynamic coefficients to substitude the fluid behavior. On the other hand, data-driven models are black-box models that use machine learning methods to reverse-engineer the relationship between input (motion/gusts) and output (forces) by using Computational Fluid Dynamics (CFD) or wind tunnel data. We can use both models to efficiently simulate structural response and capture various aerodynamic phenomena such as buffeting, flutter, and vortex-induced vibrations.
I studied aerodynamic force models from multiple perspectives, including their intrinsic mathematical properties, qualitative comparison, and development of new models. Part of my research work is summarised here, namely:
- On the assesment of aerodynamic models using Category Theory
- On the influence of the assumptions of aerodynamic models on the aeroelastic response
- On the data-driven aerodynamic modelling using Gaussian Processes and Neural Nets
Aerodynamic Modelling via Category Theory
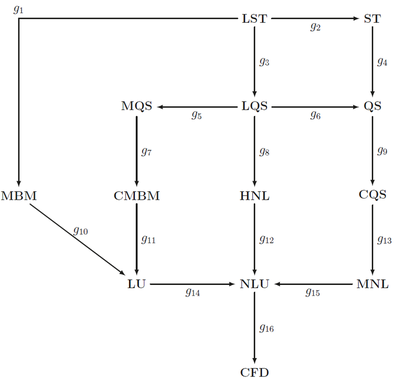
Initially, we employed and extended an abstract framework based on Category Theory to evaluate the complexity of aerodynamic models and establish a basis for comparison among semi-analytical models based on their mathematical constructions (i.e., assumptions). Category theory, sometimes referred to as “abstract nonsense” by some, is a mathematical theory that deals with structures such as categories, objects, arrows, and the rules that relate them. Using this theory, we constructed a diagram defining aerodynamic model complexity. This immediately allows for comparisons between models without the need for prior knowledge of the semi-analytical models. For example, we cannot compare models if there is no direct diagramic relation between them (see below). More information on the modeling framework, including the definition of model comparability, simplest and most complex models, as well as practical considerations, can be found in our Royal Society Open Science paper.
Influence of Model Assumptions on the Aeroelastic Response
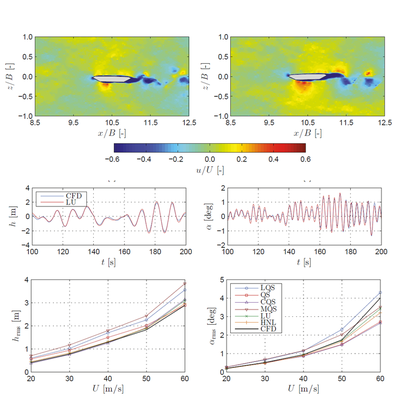
In addition to quantitative comparison, we examined the direct impact of aerodynamic assumptions on the buffeting response and critical flutter velocity. To do this, we compared the semi-analytical models to each other and to a CFD model by conducting a one-to-one comparison using identical wind turbulence input. The video below illustrates a one-to-one comparison between the Linear Unsteady (LU) semi-analytical model and the CFD model.
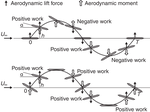
It turns out that, the fluid memory assumption, captured by the Linear Unsteady (LU) model, plays a crucial role in the aerodynamic response. This can be seen from the figures below, which depict the buffeting response. The LU and the hybrid nonlinear model (HNL) demonstrate the closest match to the CFD model, which is used as the reference due to its higher complexity (as previously depicted in the complexity diagram above).
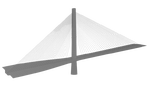
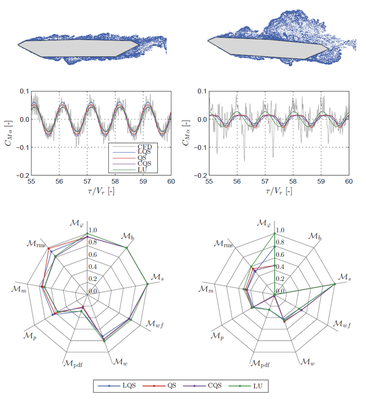
Additional comparisons can be found in our two papers, one in Engineering, and the other in Fluids and Structures. The first paper is based on a modified model of the Mersey Gateway Bridge (UK) (see video below) in its construction stage and it also presents a simplified method for employing the aerodynamic admittance in the time-domain based on Fourier Transform. The second paper is, to the best of my knowledge, the first study that conducts a comprehensive one-to-one comparison between CFD and semi-analytical models for buffeting and flutter analyses.
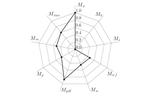
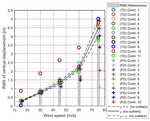
Dealing with time-histories (response or forces), comparisons based on the root-mean-square and peak values are not exhaustive to quantify the differences between models. Thus, we introduced a set of eight comparison metrics to quantify the discrepancies between two signals by looking at salient signal features relevant for structural aerodynamics. Each metric ranges from 0 to 1, with 1 indicating a perfect match. We propose eight metrics, including: phase, peak, root-mean-square, magnitude, wavelet and normalized wavelet (time-frequency), and bispectrum (second-order harmonic). For instance, the bispectrum metric quantifies the difference in second-order nonlinearities that may occur in the self-excited aerodynamic forces at large angles of attack. The comparison metrics are explained in detail in our Engineering Mechanics paper (incl. code - Github link).
Data-driven Aerodynamic Models via Gaussian Processes and Neural Nets
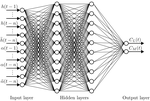
Semi-analytical models are only as good as their mathematical properties, and it can be challenging to construct a white-box mathematical model that can capture memory-dependent nonlinearities and subsequently determine the corresponding aerodynamic coefficients (e.g., Volterra Series). To overcome this challenge, we employ data-driven techniques to reverse-engineer the model by learning the latent function that maps input (angle of attack) to output (aerodynamic force). We used both Gaussian Process (GP) Regression and Artificial Neural Networks (ANNs) as machine learning methods to construct the latent function; thereby, significantly increasing the mathematical capabilities of the model compared to semi-analytical models. The other key ingredient in constructing such model, which is fortunately abundant in wind engineering due to wind tunnel experiments, is data. Training the model requires appropriate data that reflects the use of the model. In practice, this means that the training signals should contain amplitudes and frequencies of the angle of attack that the bridge is expected to exhibit during flutter or buffeting. To address this, we developed a simple method based on Fourier transform that generates training signals for coupled motion.
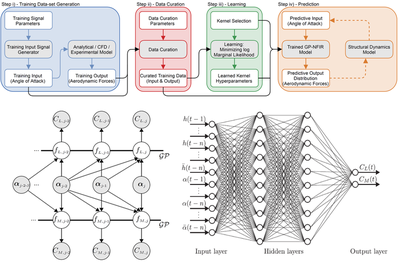
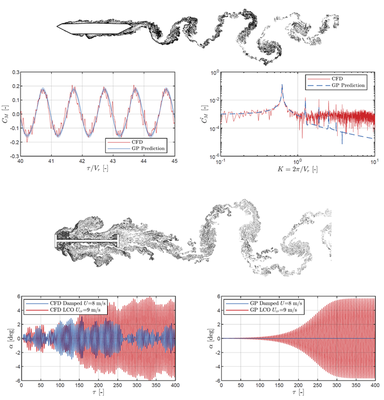
In our Journal of Wind Engineering and Industrial Aerodynamics paper (incl. code - Github link), we were able to train a GP model for self-excited forces, verify it using flat plate linear solutions, and predict second-order harmonics for Great Belt Bridge deck and Limit Cycle Oscillations (LCOs) for Tacoma-like deck. This is a promising development and we are continuing to explore this direction. However, we encountered an obstacle in predicting the LCO amplitude for coupled flutter, which we suspect is due to the non-stationary nature of the frequency content in the response. Specifically, at large amplitudes, the coupled frequency shifts towards torsional vibrations caused by large leading-edge separation. Similarly, we used standard ANNs in Computers and Structures paper and successfully predicted torsional flutter; however, we did not consider coupled excitation during the learning process in this study.
We are still exploring ways to use GPs as aerodynamic force models and incorporate physical principles into them. This research will eventually become a separate project - stay tuned!